Much like a mechanical engineer, we at Kinexus break apart, inspect and help form the workforce in our Australian Defence Sector.
With the amount of Defence projects coming downrange, it’s crucial to understand what the candidate market looks like for you to best prepare your hiring strategy.
Today we dissect the Mechanical Engineer workforce, using LinkedIn and ABS data to explore who is making the gears tun and where.
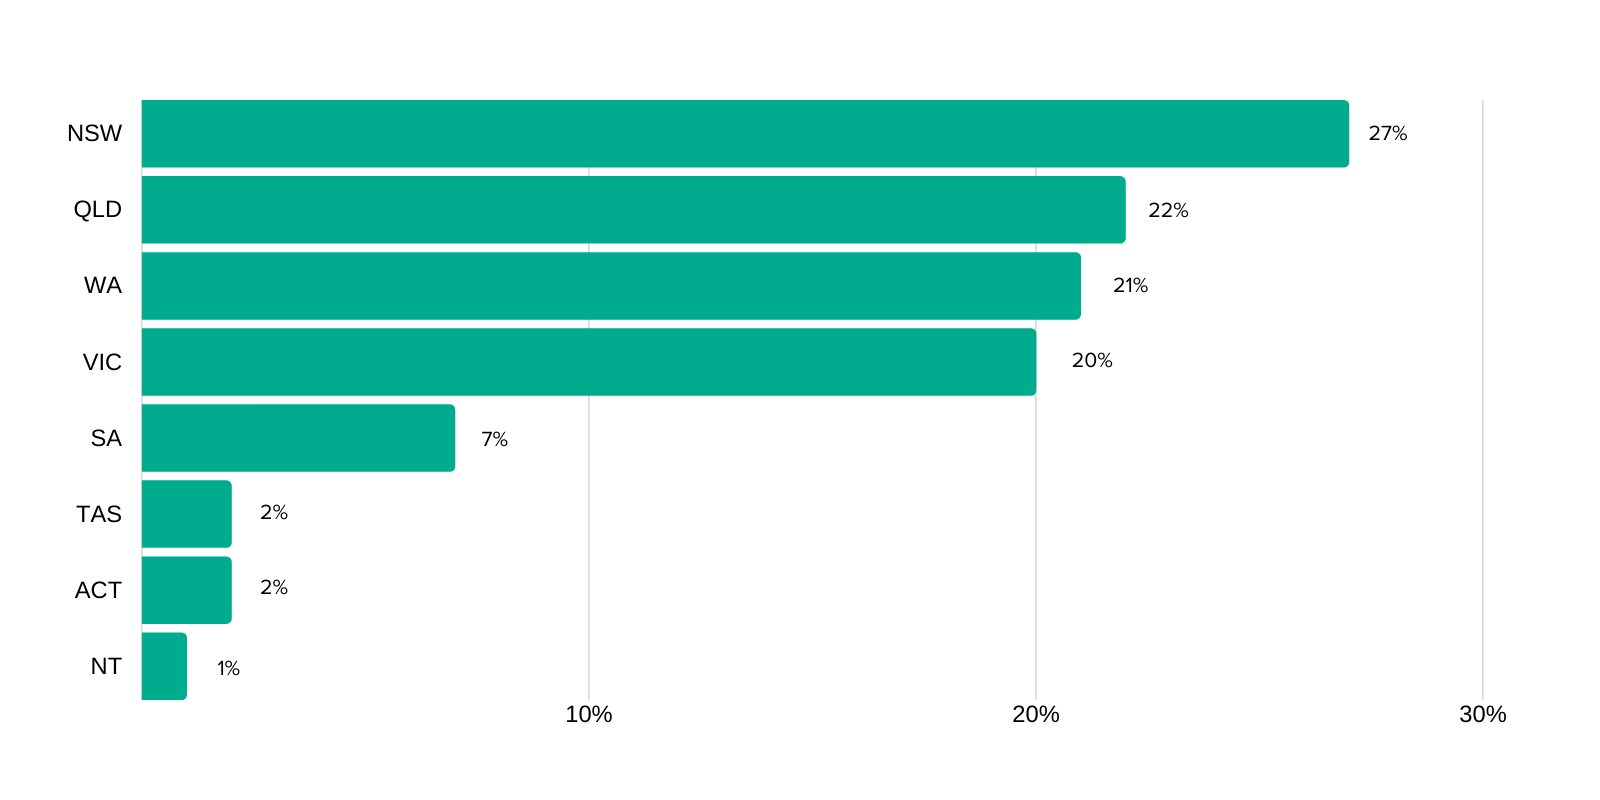
There are approximately 8,000 people who identify as currently working as a Mechanical Engineer on LinkedIn in Australia. So where are they all? The below graph dissects the workforce by state.

As you can see, NSW has the highest proportion of mechanical engineers and some other interesting figures for the state include:
- Only 10% of these NSW mechanical engineers are female;
- most are employed in the Mechanical and Industrial Engineering, followed by Construction and Mining; and
- Over the past 12 months, we can see the NSW Mining industry has been losing mechanical engineers, and the Construction industry increasing – perhaps due to the infrastructure projects boom in NSW such as the West Connex, among others.
Nationally there are some slightly different trends:
Gender
11% of the workforce is female with each state having a female percentage of around 10% -13%, except for the ACT, where 19% of their mechanical engineers are female.
Industries
Across Australia, the Mining and Oil and Energy industries have experienced an approximate 5% increase over the past 12 months of mechanical engineers working in the industry.
The Transport industry has experienced a 13% increase, as has the Aviation and Environmental Services industry.
Notably, in WA, half of the mechanical engineers work in the Mining or Oil and Energy industries. In South Australia, Defence and Space is the third most populous industry for mechanical engineers – the highest out of all the states.
Major Employers
Worley, GHD and BHP are some of the top employers of Australia’s mechanical engineers. Markedly in Western Australia, Worley, BHP and Fortescue Metals Group increased their mechanical engineers employ by more than 20% in the last 12 months. In defence industry, BAE, KBR and ASC are some of the top employers of mechanical engineers across Australia.
Employment
Nationally and across each state, 95% or more of the resident mechanical engineers were employed. Approximately 85% reported as being employed fulltime, with approximately 10% working part-time. Tasmania noticeably had an incredibly low unemployment rate for their mechanical engineer population.
Experience
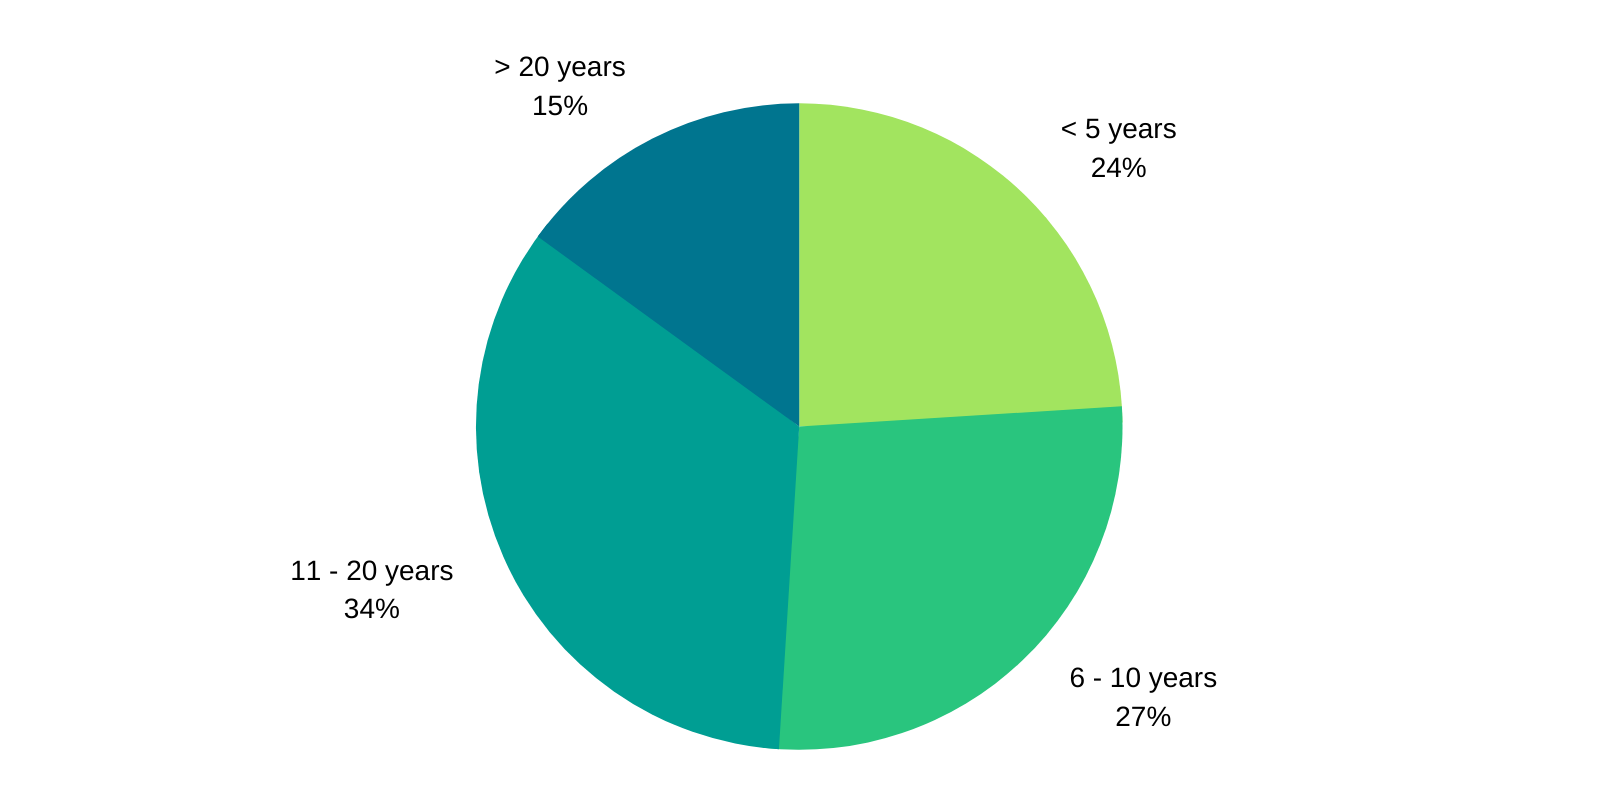
Nearly half of the mechanical engineers in Australia have more than ten years’ experience, as shown in the graph below. Regional NSW, such as the Hunter region, display a higher percentage of experienced engineers, and a lower portion of young graduates.

What does this mean for Defence Industry?
All of the top industries could be considered highly relevant, or adjacent, to Defence Industry – suggesting a viable talent pool for Defence. The limited market does suggest there is a need to look sideways to find the people you need. Furthermore, approximately 10% have worked on a Defence project or in the ADF previously.
In terms of availability of a security clearance, 76% of the national mechanical engineering workforce are Australian citizens. Less than 10% of the national mechanical engineering workforce list their country of birth in an ITAR restricted country.
With mechanical engineering being in such demand for the defence sector, it’s interesting to see that the talent pool will likely need to be sourced from adjacent industries and exactly what those industries will need to be.
For more information or to enquire into our workforce mapping services, get in touch with Rob Kremer.
Sources:
Australian Bureau of Statistics. (2016 a). 2016 Census of Population and Housing – Employment, Income and Education
LinkedIn. (2020, February). www.linkedin.com. Retrieved from www.linkedin.com.
Photo by ThisisEngineering RAEng on Unsplash


